Values can be grouped together into collections, which allows programmers to organize those values and refer to all of them with a single name. By grouping values together, we can write code that performs a computation on many pieces of data at once.
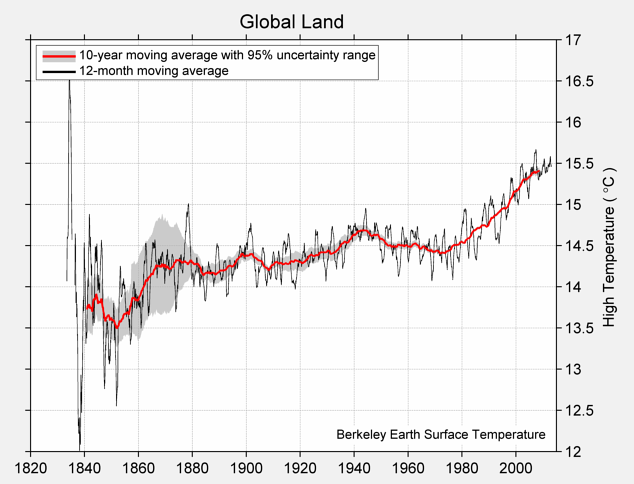
Calling the function make_array on several values places them into an array, which is a kind of sequential collection. Below, we collect four different temperatures into an array called highs. These are the estimated average daily high temperatures over all land on Earth (in degrees Celsius) for the decades surrounding 1850, 1900, 1950, and 2000, respectively, expressed as deviations from the average absolute high temperature between 1951 and 1980, which was 14.48 degrees.
baseline_high = 14.48
highs = make_array(baseline_high - 0.880, baseline_high - 0.093,
                   baseline_high + 0.105, baseline_high + 0.684)
highs
array([13.6 , 14.387, 14.585, 15.164])Collections allow us to pass multiple values into a function using a single name. For instance, the sum function computes the sum of all values in a collection, and the len function computes its length. (That’s the number of values we put in it.) Using them together, we can compute the average of a collection.
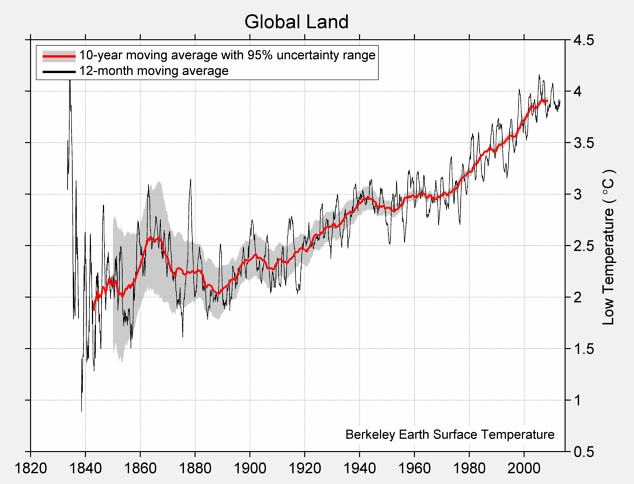
sum(highs)/len(highs)14.434000000000001The complete chart of daily high and low temperatures appears below.
Mean of Daily High Temperature
Mean of Daily Low Temperature